
Wireshark Basic Usage
一、Introduction
Wireshark is currently one of the most widely used network packet analysis software in the world. The function of network packet analysis software is to listen to network packets and display the most detailed network packet information as much as possible. Wireshark uses Winpcap as the interface to directly exchange data packets with the network card.
The following figure shows the initial interface after successfully installing Winpcap and Wireshark:

In the initial interface of Wireshark, the fluctuating line represents the fluctuation of the information transmitted by the network card. Click the start icon in the upper left corner to enter the packet capture page shown in the following figure:

二、Packet Capture and Analysis
This example demonstrates packet capture using the curl and ping commands.
Start capturing with Wireshark, and then, as shown in the following figure, use the curl and ping commands in the terminal to interact with the target address:


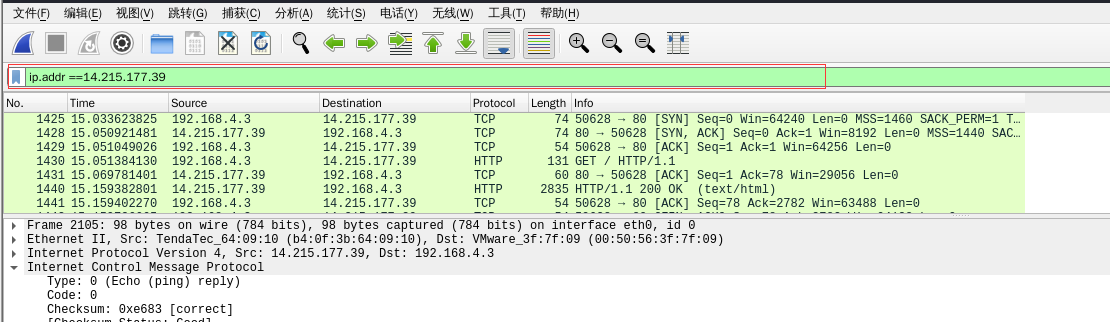
From the response packets of ping, we can see that we received 7 response packets. The IP address of Baidu here is 14.215.177.39.
Returning to Wireshark, filter the packets by IP address in the filter, as shown in the following figure is the result of filtering the packets. The filter command is:
1 | ip.addr ==14.215.177.39 |
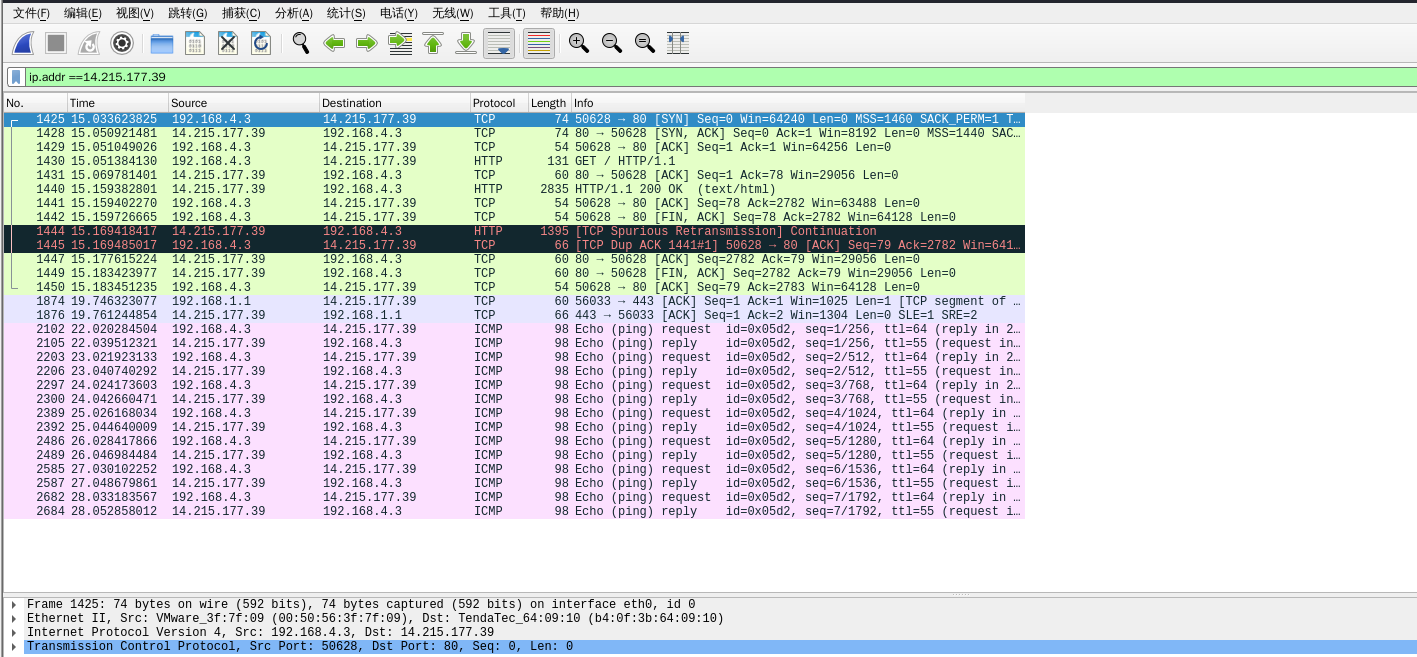
1.TCP Three-Way Handshake Analysis
Viewing the packets, in the above figure, packets 1-3 are using the TCP protocol, and packet 4 is using the HTTP protocol, which is a clear sign of the TCP three-way handshake. The first three packets are the process of the TCP three-way handshake. The following figure shows the detailed packet contents of the TCP three-way handshake, which can be compared with the packet flag bits of the TCP three-way handshake.

2.ICMP Protocol Analysis
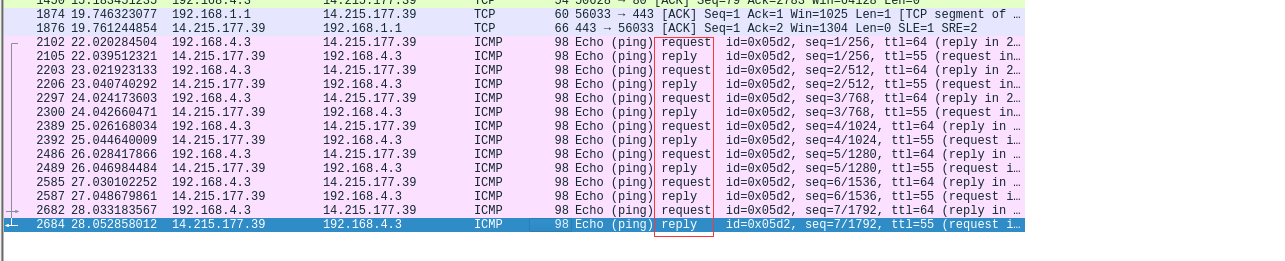
The ping command belongs to the ICMP protocol. Viewing the ICMP packets in the filtered packets, we can observe 14 packets. As mentioned earlier, 7 response packets were received for the ping destination address.
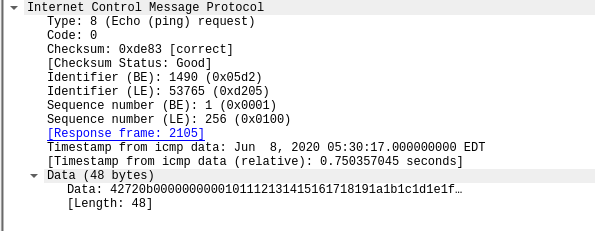
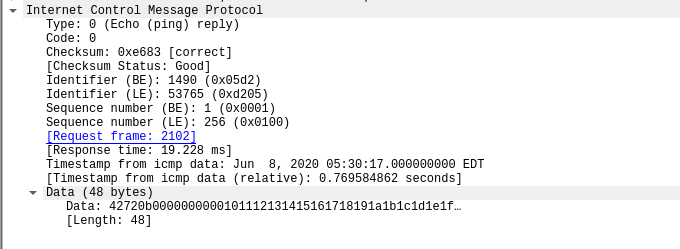
ICMP packets have two modes: request and response. See the following figure for details::
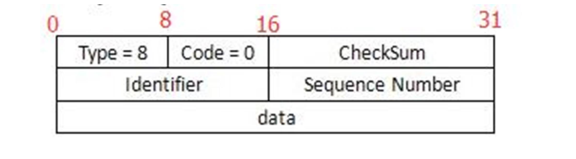
The ICMP Request and Reply message formats are as follows:
Request:
Reply:
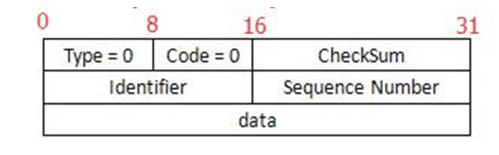
Type indicates the type of ICMP message, 8 for request messages and 0 for reply messages;
Code = 0;
CheckSum is the checksum from the ICMP header (starting with Type) to the end of the data (ending with the entire packet);
Identifier is the identifier set by the host, usually set to the process ID. The identifier in the response message is the same as the identifier in the original message;
Sequence Number is the sequence number set by the host, usually set to an increasing sequence starting from 0. The sequence number in the response message is the same as the sequence number in the original message;
Data is the data set by the host. The data in the response message is the same as the data in the original message;
Note: The Identifier and Sequence Number fields are divided into [BE] and [LE]. [BE] is for Linux content, and [LE] is for Windows content. Since this experiment was conducted in a Linux environment, only the [BE] content needs to be viewed.
Request Message Header :
Reply Message Header:
三、Introduction to Wireshark filters
One of the core features of Wireshark is the use of filters. There are three states for display filters: red, yellow, and green. Red means that the display filter expression is incorrect, yellow means that the filter expression can filter packets but may result in unpredictable results, and green means that the filter expression is correct.
Wireshark filters are divided into two types: display filters and capture filters. Display filters filter captured packets based on filtering rules, while capture filters only capture packets that meet the filtering rules that have been set in advance.
Capture Filter:
As shown in the following figure is the capture filter settings. :

The reason for setting a capture filter is to target situations where the network traffic is very large, such as several gigabytes per second, and most of the traffic is not the data that the analyst is interested in. In this case, a capture filter can be used to capture only the specified data. Useless data can not only interfere with analysis, but also waste storage space and copying time.
Display filter:
The following image shows the setting of a display filter :
Common syntax of display filters:
Protocol filter, such as http, icmp, etc;
Filter by specific port: tcp.port eq 80, displays packets with port 80 whether it is a source or destination port. To filter by the source port, use tcp.srcport eq 80, and to filter by the destination port, use tcp.dstport eq 80;
Filter by source IP address: ip.src eq 192.168.1.107, and to filter by the destination, use ip.dst eq 192.168.1.107. To filter by both source and destination, use ip.addr eq 192.168.1.107. MAC address filtering follows the same logic;
Filter packets containing a specific string domain name, such as http.host contains “moe”;
Multiple filter conditions can be used together, for example, to simultaneously filter for http protocol and port 80, use http && tcp.port == 80. Combination symbols include AND/&&, OR/||, and NOT/!;
The syntax of capture filters is slightly different from display filters, and some examples are as follows:
- Filter by specific protocol: http
- Filter by specific port: port 80
- Filter by specific IP address: host 192.168.0.115
- Filter by specific domain name: host www.example.com